Advanced Techniques for Analyzing Network Traffic with Chrome DevTools
Advanced techniques for analyzing network traffic in Chrome DevTools
Introduction
Network Traffic Monitoring is an essential part of web application testing, and Chrome DevTools provides powerful tools for monitoring network traffic. With Python and Selenium, you can automate the collection of network traffic data and analyze it to identify issues and loopholes.
Here's a step-by-step guide on how to achieve Network Traffic Monitoring using Python and Selenium with Chrome DevTools:
Step 1: Install Required Libraries
First, install the required Python libraries: selenium, browsermob-proxy, and haralyzer.
pip install selenium
pip install browsermob-proxy
pip install haralyzer
Step 2: Start BrowserMob Proxy
BrowserMob Proxy is a proxy server that can be used to capture network traffic. You can start BrowserMob Proxy using the following code:
from browsermobproxy import Server

server = Server("path/to/browsermob-proxy")
server.start()
proxy = server.create_proxy()
Make sure to replace "path/to/browsermob-proxy" with the actual path to the browsermob-proxy executable on your machine.
Step 3: Set Up ChromeDriver with Proxy
Next, set up ChromeDriver to use the proxy server. You can do this using the --proxy-server option when starting ChromeDriver:
from selenium import webdriver

chrome_options = webdriver.ChromeOptions()
chrome_options.add_argument("--proxy-server={0}".format(proxy.proxy))
driver = webdriver.Chrome("path/to/chromedriver", chrome_options=chrome_options)
Make sure to replace "path/to/chromedriver" with the actual path to the chromedriver executable on your machine.
Step 4: Start Network Traffic
Capture Now that ChromeDriver is set up to use the proxy server, you can start capturing network traffic:
proxy.new_har("my-test")
driver.get("https://www.example.com")
The proxy.new_har method starts a new HAR (HTTP Archive) file to capture the network traffic. The driver.get method navigates to the specified URL and triggers network requests.
Step 5: Analyze Network Traffic Data
After running your test, you can analyze the network traffic data using the haralyzer library:
from haralyzer import HarPage

har_page = HarPage("my-test.har")
entries = har_page.entries
for entry in entries:
    if entry.response.status != 200:
        print("Request failed: {0} {1}".format(entry.request.method, entry.request.url))
This code loads the HAR file into a HarPage object and retrieves the entries. It then iterates over the entries and checks if any requests failed (had a status code other than 200).
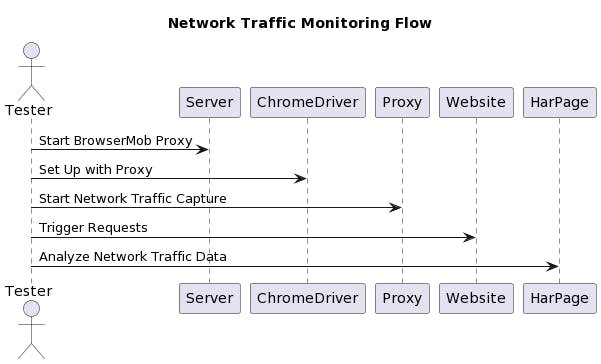
Here is a visual representation of the entire flow.

For detailed code, refer to this repo on GitHub.
Sample HAR (HTTP Archive)
A HAR (HTTP Archive) file is a JSON-formatted file that contains information about the HTTP requests and responses for a web page. Here's a simplified example of what a HAR file might look like:
{
  "log": {
    "version": "1.2",
    "creator": {
      "name": "BrowserMob Proxy",
      "version": "2.1.4"
    },
    "entries": [
      {
        "startedDateTime": "2023-04-01T12:00:00.000Z",
        "time": 50,
        "request": {
          "method": "GET",
          "url": "https://www.example.com/",
          "httpVersion": "HTTP/1.1",
          "headers": [
            {
              "name": "User-Agent",
              "value": "Mozilla/5.0 (Windows NT 10.0; Win64; x64) AppleWebKit/537.36 (KHTML, like Gecko) Chrome/95.0.4638.54 Safari/537.36"
            }
          ],
          "queryString": [],
          "headersSize": 247,
          "bodySize": 0
        },
        "response": {
          "status": 200,
          "statusText": "OK",
          "httpVersion": "HTTP/1.1",
          "headers": [
            {
              "name": "Content-Type",
              "value": "text/html; charset=utf-8"
            }
          ],
          "content": {
            "size": 1024,
            "mimeType": "text/html"
          },
          "headersSize": 340,
          "bodySize": 1024
        },
        "timings": {
          "blocked": 0,
          "dns": 20,
          "connect": 10,
          "send": 0,
          "wait": 15,
          "receive": 5,
          "ssl": -1
        },
        "_initiator": {
          "type": "other"
        },
        "_priority": "VeryHigh",
        "serverIPAddress": "93.184.216.34",
        "connection": "keep-alive"
      }
    ]
  }
}
In this example, you can see information about the request and response for the main document of the web page, including headers, content types, sizes, and timings. When you execute the provided code, the network_traffic variable will contain a similar JSON object with details about the network requests and responses generated during the browsing session.

